Polaris Pacific, the leading real estate sales and marketing group for new residential communities, has introduced a weekly, real-time market trend dashboard that measures changes to the condominium sector of eight core West Coast markets and provides data to navigate the complexities created by COVID-19 on these condominium markets.
Updated every Tuesday, the Polaris Pacific COVID-19 Dashboard provides real-time statistics and insights that reveal a rare, data-driven vantage point on the ongoing effects of the pandemic. Currently, no other research reporting tool exists that analyzes specific condominium data on a weekly basis. The core cities monitored in the dashboard includes Denver as well as San Francisco, Los Angeles, San Diego, Silicon Valley, Oakland/Emeryville, Phoenix, and Seattle.
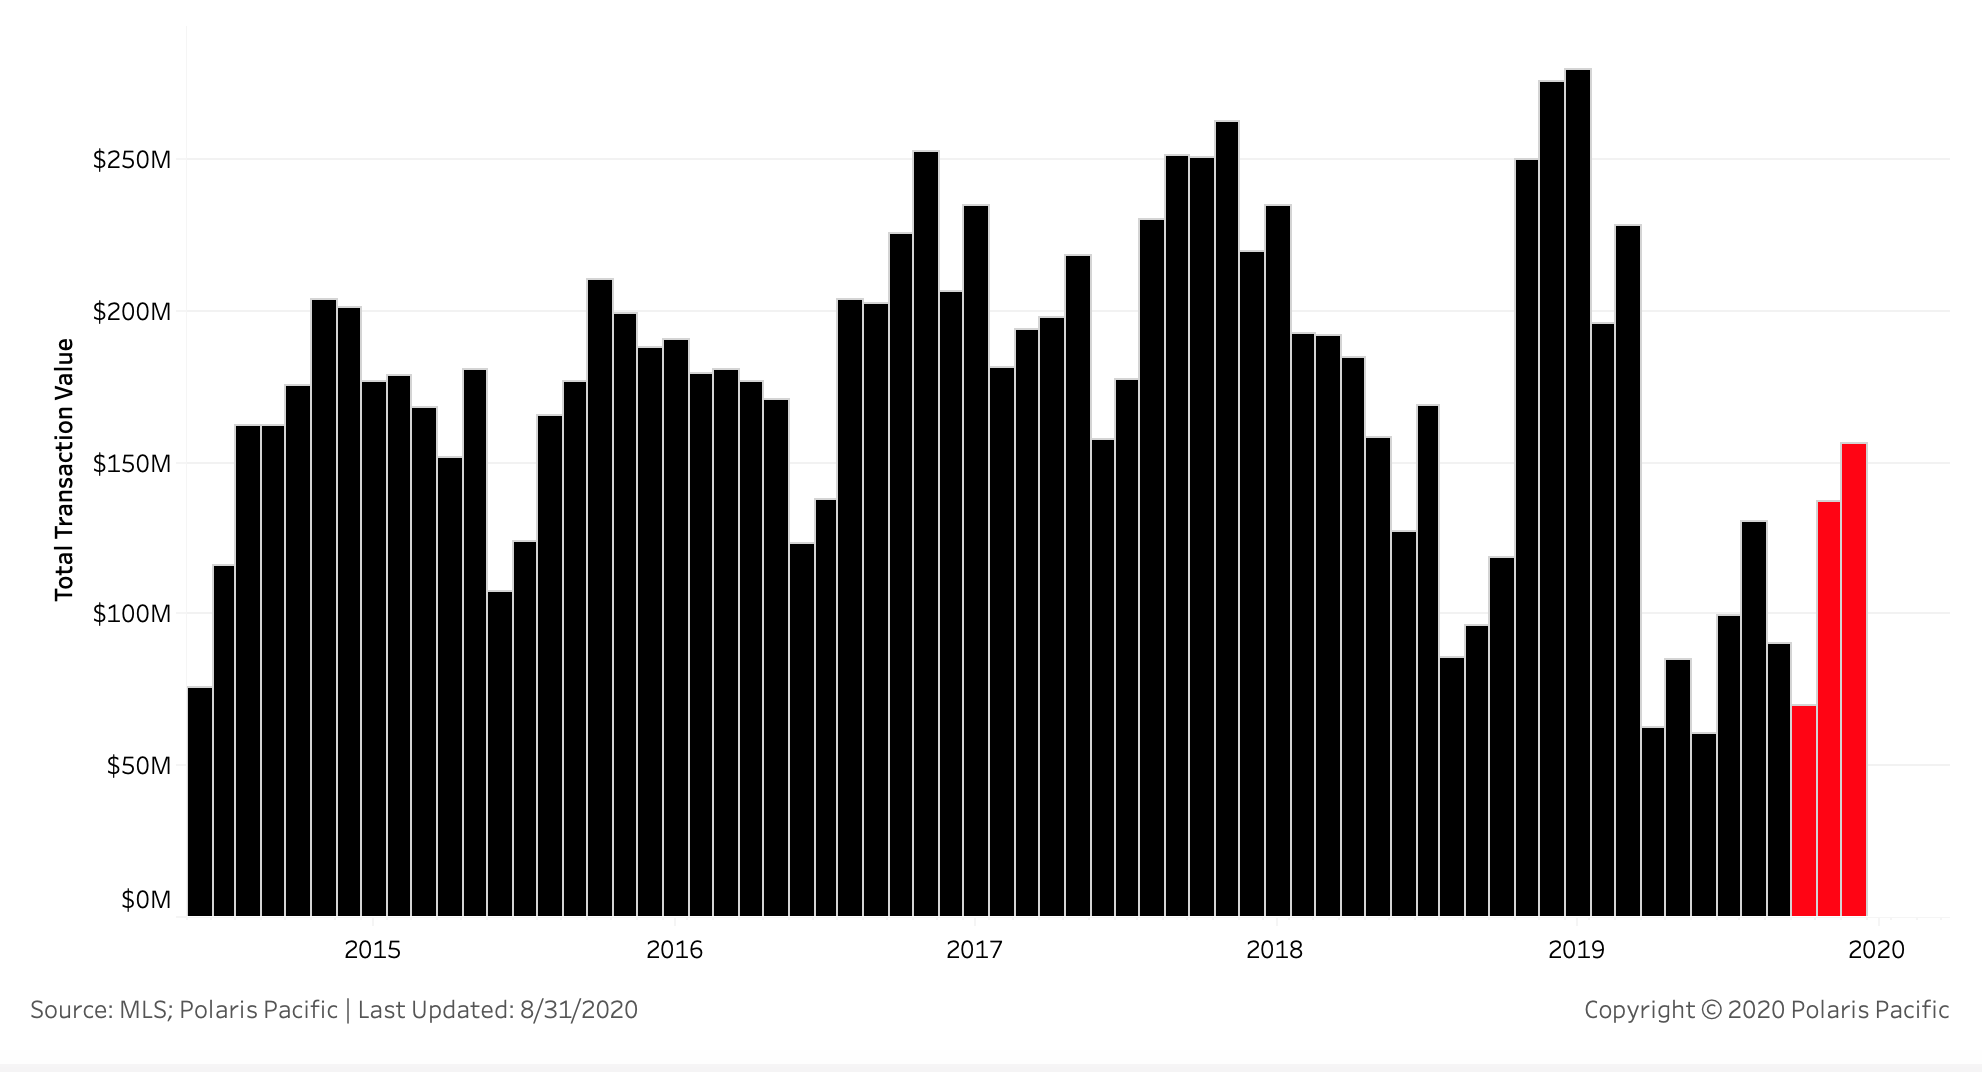
- Monthly transaction volume has been relatively slow for all of 2020 in Denver. Taken through this lens, June and July were 2020’s top-performing months. However, sales levels are nowhere near the annual highs of the past five years.
- Denver has experienced an increase in median sale price that began in April.
- July saw more robust sales in the lower price tiers (below $600,000) than previous months.
“Our experience with COVID-19 indicates that the various segments of the housing market are acting in radically different manners. Broad-measure tools like Case Schiller have worked in the past to assess the total housing market but are not working effectively in the current situation. The weekly data that we are providing highlights how various markets operate independently of one another and how local pandemic conditions affect sales,” says Garrett Frakes, managing partner of Polaris Pacific.
To view the data within the Polaris Pacific COVID-19 Dashboard, click HERE.


