According to CBRE’s Q3 market reports, downtown Denver office leasing fundamentals show steady improvement as vacancy edges higher, while Southeast Denver’s office sublease space continues to trend downward but translates to increased direct vacancy. Denver’s retail market stability persists amid economic uncertainty and multifamily continues to display resilience, despite uncertainty in the capital markets.
Key Takeaways:
- Q3 2023 posted just under 25,000 sq. ft. of positive net absorption, bringing the year-to-date total to positive 485,000 sq. ft.
- Direct vacancy increased 10 basis points (bps) quarter-over-quarter to 6.0%, while the total availability rate increased 20 bps to 6.5%.
- The average asking rent in metro Denver saw a healthy 1.8% quarter-over-quarter increase to $19.90 per sq. ft. NNN.
- The construction pipeline exceeded 486,000 sq. ft. in Q3 2023. Five projects totaling just over 74,000 sq. ft. were completed in the third quarter, a 68.2% decrease in deliveries quarter-over-quarter.
- Sales volume totaled $197.9 million in the third quarter of 2023, a strong 29.9% quarter-over-quarter increase and an 83.6% increase year-over-year.
- The overall occupancy rate increased 20 basis points to 94.3% in Q3 2023. The historical Q3 occupancy from 2000-2019 has averaged 94.4%.
- The average asking rent increased to $1,934 per unit or $2.22 per square foot (sq. ft.), up approximately $20 per unit quarter-over-quarter and up $14 per unit year-over-year.
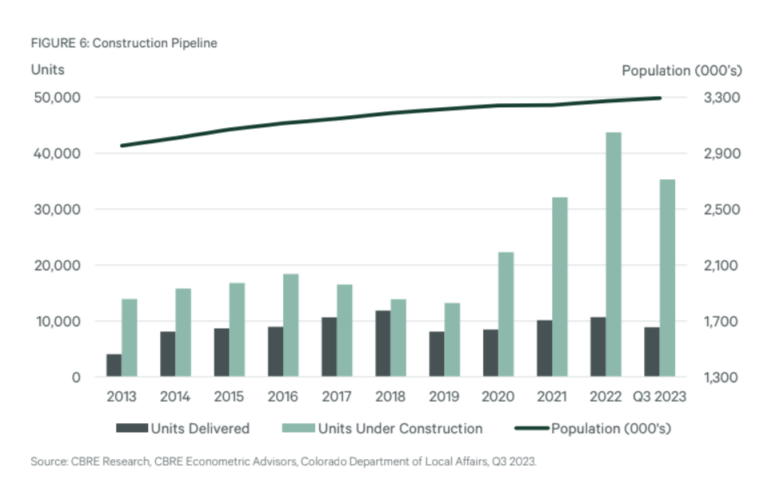
- Development activity appears to have peaked. At the end of Q3 2023, there were 35,300 units under construction spread across 139 properties.
- 2,959 units delivered this quarter, pushing the 2023 year-to-date total to 8,873 units. While there were few construction starts this quarter, deliveries are expected to remain elevated through 2024 as many developments are nearing completion.
- Net absorption was positive 3,326 units in Q3 2023 and 7,822 units year-to-date. Demand remained strong as metro Denver recorded the sixth highest Q3 2023 net absorption and the third highest Q2 2023 net absorption across all markets in the U.S.
- Q3 2023 transaction volume totaled $1.05 billion, a significant increase of 126.7% quarter-over-quarter but down 12.4% year-over-year. Third quarter transaction volume was slightly more than the combined total for the first half of 2023.

- Total vacancy rose 130 basis points (bps) in Q3 2023 to 30.6% and was up 200 bps year-over-year. Class A vacancy rose 100 bps during the quarter to 23.1%.
- Net absorption of negative 381,600 sq. ft. was recorded in Q3 2023, bringing the year-to-date total to negative 477,300 sq. ft.
- Sublease availability dropped for a second straight quarter after declining 13.1% in Q3 2023 to slightly below 2.0 million sq. ft.
- Leasing activity totaled 494,600 sq. ft., up from the 388,700 sq. ft. recorded in the second quarter. Q3 2023’s rolling four-quarter total was 17.0% higher than the previous quarter’s. Renewals have accounted for 51.0% of activity over the past 12 months.
- The submarket’s average direct asking rent was up slightly in Q3 2023 and largely unchanged year-over-year at $39.86 per sq. ft.
- No new construction starts were seen this past quarter, keeping 1900 Lawrence as the only project under construction Downtown.
- Negative 558,000 sq. ft. of total net absorption was posted in Q3 2023, the highest negative amount since Q2 2022.
- No new office projects broke ground this quarter, as developers dealt with increased interest rates and tepid demand.
- Leasing activity increased 36.6% quarter-over-quarter to 433,000 sq. ft., with Class A buildings accounting for 89.9% of total activity.
- Sublease availability fell for the second consecutive quarter, reaching 1.8 million sq. ft. or a decrease of 6.1% quarter-over-quarter.
- Total vacancy increased 150 bps quarter-over-quarter to 21.3%, while direct vacancy rose 140 bps to 17.8%.
- The average direct asking rent remained resilient, increasing to $28.41 per sq. ft. FSG.


