
As vaccinations increase and companies are setting firmer targets for workers to return to the office, during the second half of 2021, at least part- time. In light of this, sublease space continues to be added to the market.
Cushman & Wakefield has released a new Sublease Space Report with insights and data on the latest trends across North America. The report tackles questions such as: Why North American sublease space has nearly doubled during the pandemic; How it compares with previous sublease peaks; and Where markets across North America stack up.
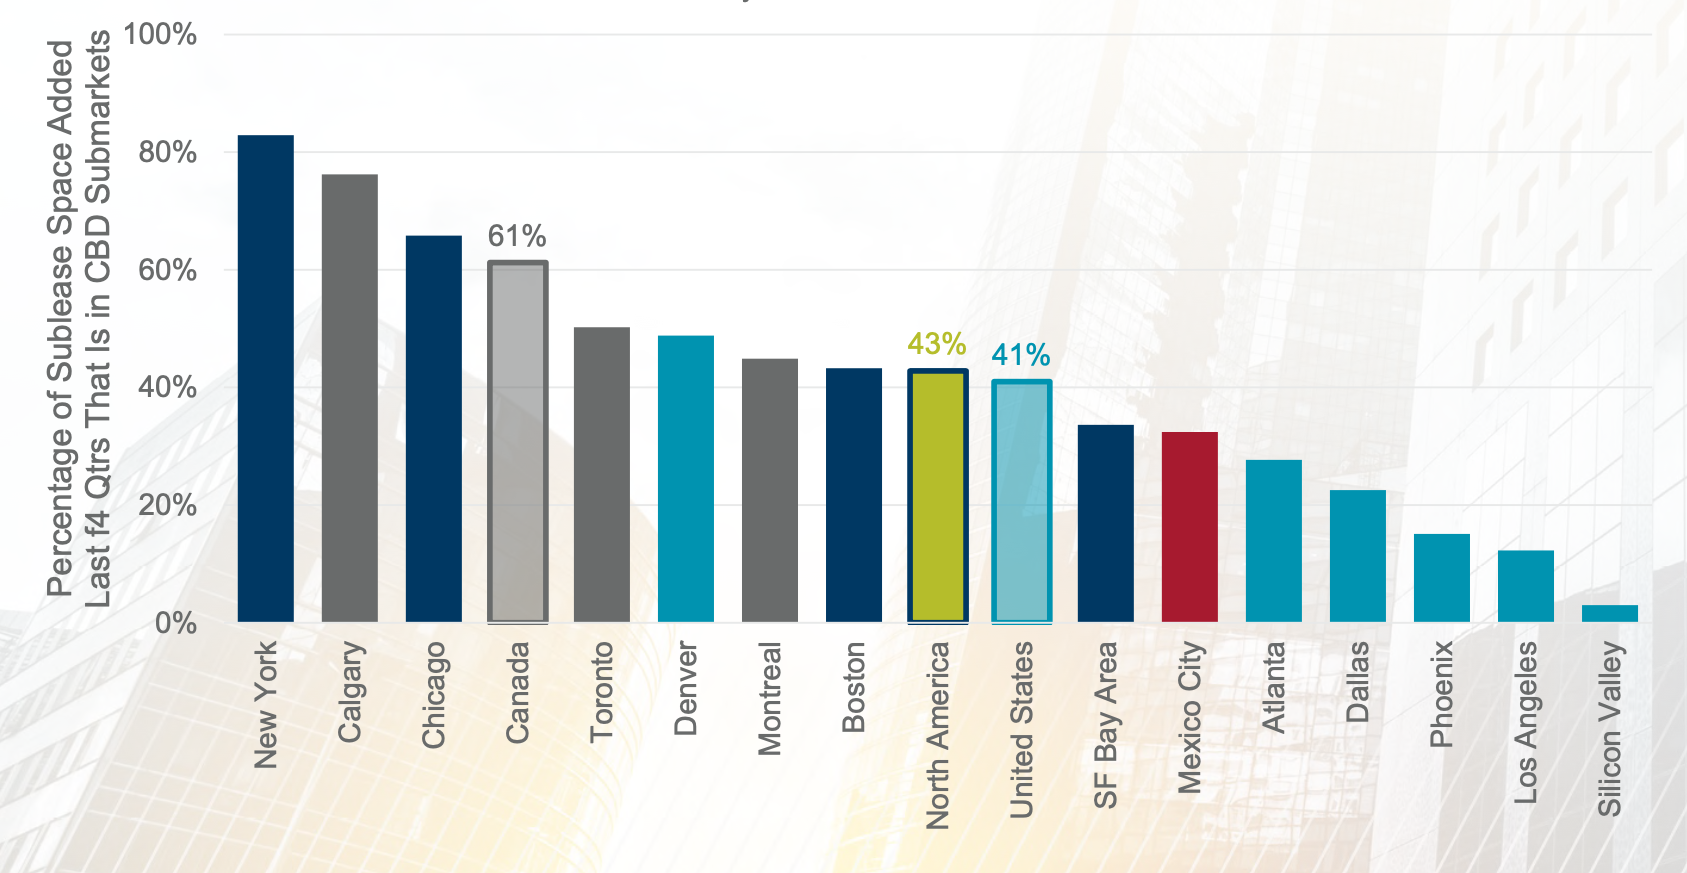
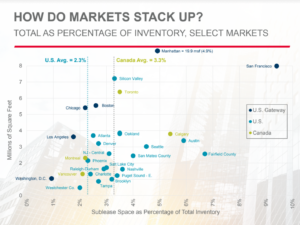
The total amount of sublease space has now surpassed both the levels recorded during the Great Financial Crisis (GFC) and the Dot-Com Recession (DCR). Across the U.S. and Canada, sublease space accounted for 2.4% of total office inventory, up from 1.2% at the end of 2019. That is above the GFC (1.8% of inventory) but remains below the DCR (2.9%).
Denver Sublease Stats as of Q1 2021
Based on vacancy
The percentage of sublease vacancy to total vacancy in the Denver CBD is 22.5%: direct vacancy is 4,986,374 SF and sublease vacancy is 1,446,121 SF for total vacancy of 6,432,495 SF.
Comparatively, the percentage of sublease vacancy to total vacancy in the overall Denver market is 14.4%: direct vacancy is 19,033,935 SF and sublease vacancy is 3,205,126 SF for total vacancy of 22,239,061 SF
Based on inventory
The percentage of sublease vacancy to total inventory in the Denver CBD is 4.6%: Denver CBD inventory is 31,111,269 SF and sublease vacancy is 1,446,121 SF.
Comparatively, the percentage of sublease vacancy to total inventory in the overall Denver market is 2.7%: overall Denver market inventory is 119,173,709 SF and total market sublease vacancy is 3,205,126 SF.