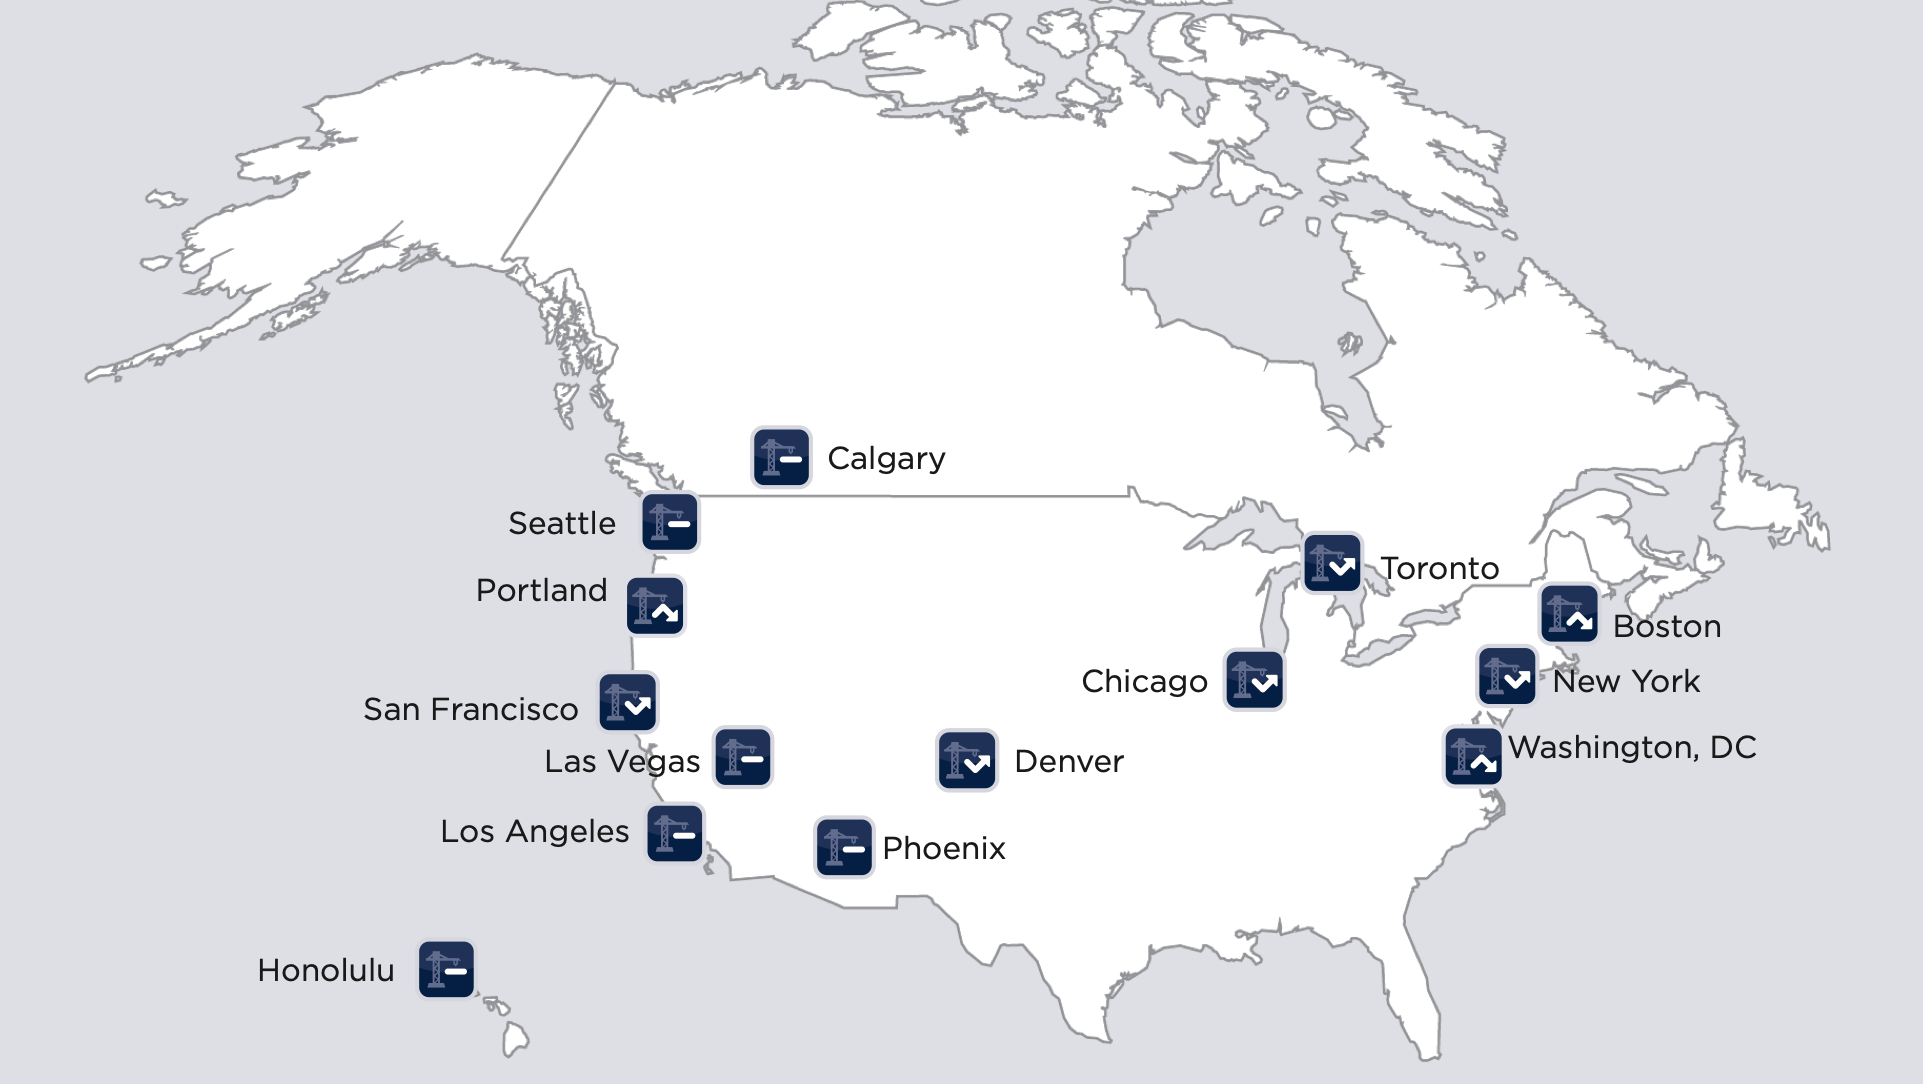
International property and construction consultancy firm Rider Levett Bucknall (RLB) has released its latest Crane Index and Quarterly Cost Report. Together, the two documents provide an on-the-ground picture of construction activity in 14 key North American markets and data-driven insights into the industry.
While the surge of the COVID-19 Omicron variant is subsiding, pandemic-induced problems remain. Supply chain issues continue to plague all levels of the construction industry, from raw materials to finished products, as pent-up demand for building supplies grows. A spike in fuel prices and a shortage of truck drivers are still slowing overland transit of goods, a condition exacerbated by a lack of warehouse space.
Significant recent events — the Russia-Ukraine war and inflation — are now compounding the current picture. The conflict in eastern Europe is likely to affect the costs and availability of some key materials; Russia is a major producer of copper and aluminum. Inflation is on the rise, pushing prices across the board higher.
“It’s a complicated situation,” said Julian Anderson, FRICS, president of RLB North America. “While the bipartisan passage of the $110 billion Infrastructure Investment and Jobs Act is a major step forward, it remains to be seen how inflation will affect its implementation.”
Crane Index notes:
- Cities seeing an increase in cranes include Chicago, Denver, New York, San Francisco, and Toronto
- Cities holding steady in their crane counts include Honolulu, Las Vegas, Los Angeles, and Phoenix
- Cities with a decrease in cranes include Boston, Calgary, Portland, Seattle, and Washington, D.C.
- The top three sectors for cranes are residential, mixed-use, and commercial
Even as many downtown projects are completed, Denver has experienced a significant increase in its crane count.
This is due to the continuing redevelopment of the Five-Points/Cole/RiNo areas, as developers capitalize on what seems to be a never-ending demand for apartments. Many include a component of mixed-use amenities such as grocery stores, entertainment venues, office space, and parking. Downtown, there are several new office developments on the drawing board.
Quarterly Cost Report notes:
- The U.S. quarterly national average increase in construction cost is approximately 1.58%, compared to 8.04% year-over-year
- The U.S. Gross Domestic Product (GDP) is 7.0%
- The Architectural Billings Index (ABI) was unchanged from the previous month’s 51.0


