
International property and construction consultancy firm Rider Levett Bucknall (RLB) has released its latest Quarterly Cost Report and Crane Index. Together, the two documents provide an eye-opening perspective on the North American construction industry in 14 key markets.
With data current to mid-Q1 2023, the latest RLB quarterly cost report shows that the national average increase in construction costs was nearly 1.4 percent over the previous quarter with Boston, New York, Phoenix, Portland, Seattle, and San Francisco all experiencing increases over the national average this quarter. Chicago, Denver, Honolulu, Las Vegas, Los Angeles and Washington DC experienced gains were less than the national average.
Despite continued workforce challenges and economic uncertainties are still concerns for the coming year, the U.S. is continuing to see new projects break ground within the 14-key markets. This indicates that investments are continuing to be made into our cities.
“There’s an air of economic uncertainty lingering over 2023, especially around oil prices and unresolved bank stress. As compared to last year at this time, things look difficult, but for different reasons,” says Julian Anderson, FRICS, president of RLB North America. “On the bright side, inflation seems to be leaning in the right direction, and other challenges like workforce development are following suit.”
Quarterly Cost Report Notes
- The U.S. quarterly national average increase in construction cost is approximately 1.4 percent, compared to 8.11 percent year-over-year
- The construction unemployment rate is up down slightly to 4.4 percent from 5.0 percent in the same time period last year
- The Architectural Billings Index (ABI) is 49.3, reporting less than 50 for four consecutive months.
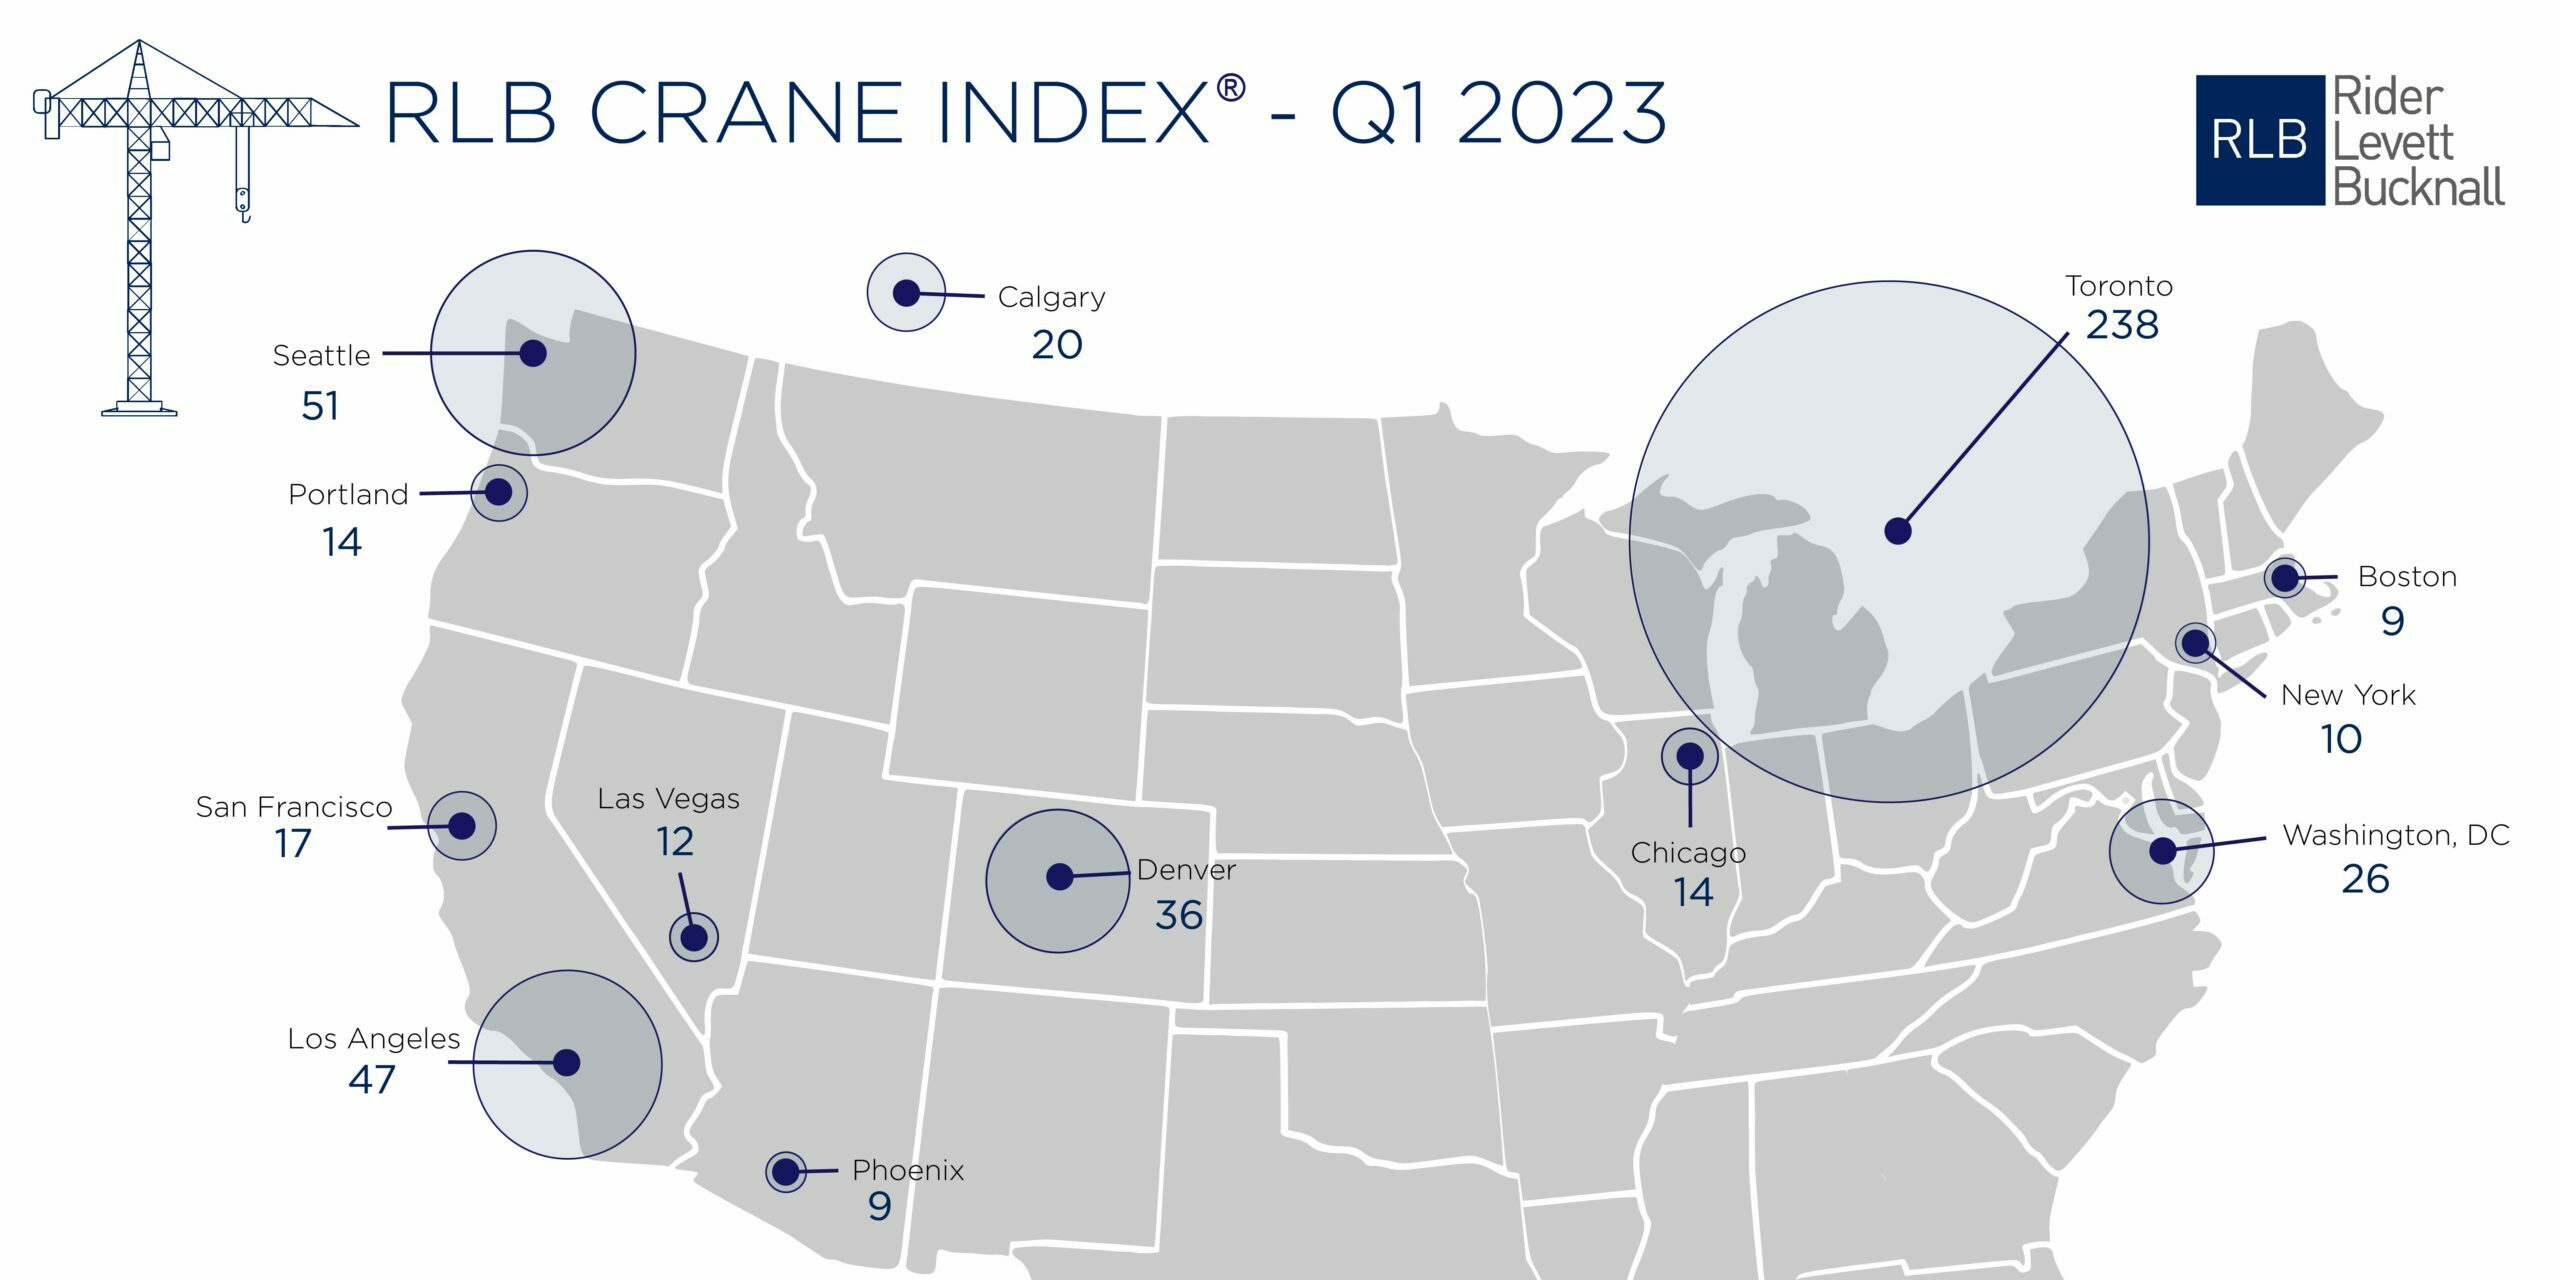
Crane Index Notes
- Cities seeing an increase in cranes include Denver, Honolulu, Las Vegas, Los Angeles, Phoenix, San Francisco, Seattle, and Toronto
- Cities holding steady in their crane counts include Boston, Calgary, Portland, and Washington DC
- Cities with a decrease in cranes include Chicago and New York
Read the complete QCR report HERE
Read the Crane Index HERE